The Acquisition Addiction Problem
There's a predictable pattern in how most growth teams operate. Leadership sees flat revenue, product pushes new features, and marketing gets asked to find cheaper acquisition channels. Everyone stays busy, metrics move slightly, and twelve months later the business is fundamentally unchanged.
The core issue is that acquisition feels like control. You can spin up campaigns, test new channels, iterate creative. Retention feels like a product problem, which means longer timelines, harder attribution, and less obvious ownership. So teams default to what they can execute quickly, even when the economics point elsewhere.
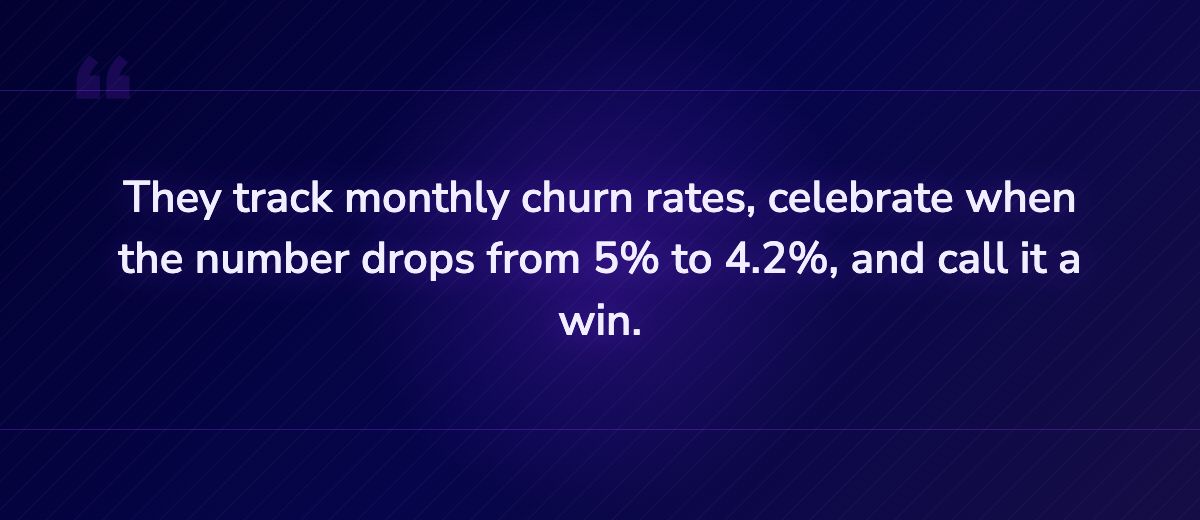
Consider the typical SaaS unit economics we've seen across mid-market B2B companies: CAC around $800-1200, average contract value $3600-4800 annually. At 70% gross margin, you need customers to stick for 6-9 months just to break even on acquisition costs. According to ProfitWell's 2023 SaaS benchmarks, the median B2B SaaS company sees 5-7% monthly logo churn in the first year. That means roughly half your new customers don't make it past month ten.
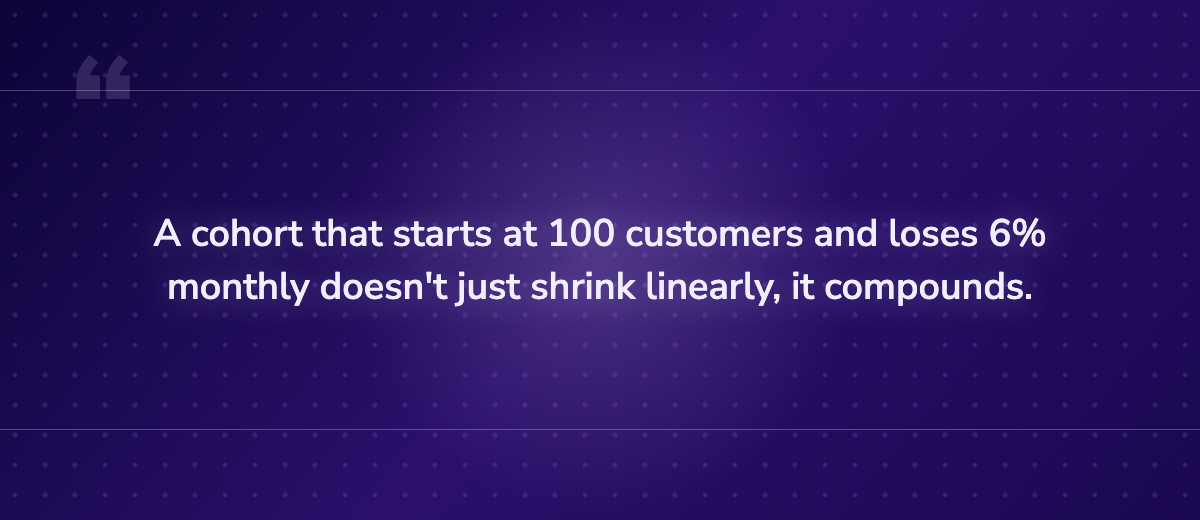
Now layer in cohort degradation. A cohort that starts at 100 customers and loses 6% monthly doesn't just shrink linearly, it compounds. After twelve months, you're at 48 customers. After 24 months, you're at 23. The revenue impact isn't additive, it's multiplicative across every cohort you've ever acquired.
This creates what we call the retention ceiling: the point where your acquisition engine can't outrun cohort decay. You can increase ad spend, improve conversion rates, hire more sales reps. But if your twelve-month retention stays at 50%, your growth curve flattens regardless of how much you pour into the top of the funnel.
The tradeoff here is real. Early-stage companies often need to prioritize acquisition to find product-market fit and build initial revenue. The shift to retention-first thinking typically makes sense once you've crossed $1-2M ARR and have enough cohort history to analyze patterns. Before that, you're still learning who your best customers are.
Cohort Analysis: The Only Retention Chart That Matters
Most retention dashboards show a single line trending over time: percentage of customers retained month-over-month. This aggregates all cohorts into one metric, which makes it fundamentally misleading. You can't tell if newer cohorts are improving, whether changes you made six months ago worked, or which segments are actually retaining.
Cohort retention tables solve this by showing each signup month as a separate row, with columns representing months since acquisition. Instead of one blended number, you get a matrix that reveals actual patterns.
Here's what a useful cohort table exposes:
Cohort maturity curves. Different customer segments often stabilize at different retention rates. Enterprise customers might drop to 95% monthly retention after month three and stay there. SMB customers might stabilize at 88% after month six. You can't see this in a blended churn rate, you need to watch cohorts mature over time.
Product or positioning changes. If you shipped a major onboarding overhaul in March, you should see March and later cohorts retain better than February and earlier. The cohort table makes causality visible in a way that blended metrics obscure.
Seasonal or channel effects. A Series B SaaS company we worked with noticed that Q4 cohorts consistently retained 12-15% worse than Q2 cohorts. Turns out their year-end discount campaigns attracted price-sensitive customers who churned as soon as renewal came at full price. The aggregate churn rate looked fine because Q4 was only 25% of annual volume, but it meant a quarter of their acquisition budget had terrible unit economics.
The most important insight from cohort analysis is the retention inflection point: the month where churn rate stabilizes. For many B2B SaaS products, this happens around month 4-6. Customers who make it past this point have integrated the product into workflows, seen value, and are significantly less likely to leave. The shape of the curve before this inflection is what retention strategy needs to address.
Where this breaks down is in businesses with very long sales cycles or highly seasonal usage. If your customer only uses the product quarterly, traditional monthly cohort analysis won't capture true engagement patterns. You'll need to adjust the time windows or track usage cohorts instead of signup cohorts.
Four Retention Levers That Actually Move the Needle
Retention isn't a single optimization problem, it's a system with distinct failure modes. Most churn happens for one of four reasons: users don't adopt core features, they don't see value quickly enough, they outgrow the product, or they experience friction that makes switching feel easier than staying.
Each failure mode has specific operational levers. Generic "improve retention" initiatives fail because they try to solve all four problems with the same tactics.
1. Activation Velocity
The biggest predictor of long-term retention is how quickly users reach their first meaningful outcome. This isn't about feature adoption, it's about value perception. Users who experience a tangible benefit within the first session or two retain at multiples of those who don't.
Research from Mixpanel's product benchmarks suggests that users who complete a defined activation event within 7 days have 3-4x higher retention at 12 months compared to those who take longer. The specific event varies by product (sending a campaign, completing a report, inviting team members), but the pattern holds across categories.
The operational lever here is time-to-value compression. Map the user journey from signup to first win, identify bottlenecks, and eliminate steps that don't directly contribute to that outcome. This often means hiding features, not showcasing them. A project management tool we audited had a 14-step onboarding flow that introduced every module. When they stripped it down to three steps focused on creating and completing one task, activation rate jumped from 34% to 61%. Retention at month six improved by 18 percentage points.
The tradeoff is that aggressive activation focus can sacrifice long-term feature discovery. Users who only learn one workflow might not expand into other product areas. This matters more for platforms with multiple use cases than single-purpose tools. You're optimizing for initial retention at the potential cost of expansion revenue.
2. Value Reinforcement Loops
Getting users to value once isn't enough. Retention compounds when users experience repeated value in a predictable cadence. The products with the highest retention rates build systematic value reinforcement: weekly reports, milestone notifications, usage summaries, benchmark comparisons.
This works because it shifts value perception from "this tool helps me when I think to use it" to "this tool proactively delivers insight I'd miss otherwise." The user isn't just getting utility, they're getting a regular reminder of that utility.
One e-commerce analytics platform we worked with had decent feature engagement but struggled to retain past month eight. They introduced a Monday morning email with three key metrics and one insight ("Your conversion rate dropped 8% last week, primarily from mobile traffic"). Open rates hit 68%, and users who engaged with three or more emails showed 27% better retention at twelve months.
The mechanism isn't the email, it's the habit formation. By creating a weekly touchpoint tied to business value, they moved from "tool I use when I have time" to "system I check every Monday." That shift changes how users perceive product necessity.
3. Expansion Paths
Natural usage growth is a leading indicator of retention. Users who increase their activity over time (more seats, higher usage volume, additional features) almost never churn. The inverse is also true: declining usage is the strongest predictor of imminent churn.
The retention lever here is creating clear expansion paths that align with customer success. This doesn't mean upselling, it means making it obvious how customers who get more value use the product differently. If successful customers typically add integrations, invite teammates, or adopt advanced features, make those paths visible and frictionless.
A B2B customer data platform we analyzed had 79% twelve-month retention for customers who connected at least three data sources, versus 43% for those who only connected one. The product team built an integration suggestions engine that prompted users based on their tech stack (pulled from LinkedIn or entered during signup). Adoption of second and third integrations increased by 31%, and cohort retention improved by 14 percentage points within six months.
This works because it aligns product behavior with value creation. You're not asking users to expand arbitrarily, you're showing them how customers who get better results actually use the product.
4. Friction Reduction
Sometimes users don't churn because they're dissatisfied with value, they churn because staying requires more effort than switching. This shows up as slow load times, confusing workflows, missing integrations, or customer support experiences that feel like work.
According to Zendesk's 2023 CX Trends report, 61% of customers switch to a competitor after one bad service experience. In SaaS, friction compounds over time. A user who has to contact support monthly, wait for responses, and work around product limitations builds resentment even if they see value.
The operational fix is systematic friction mapping. Track every point where users get stuck, need help, or encounter errors. Prioritize based on frequency and impact. A marketing automation platform we worked with discovered that 23% of users contacted support about the same integration issue within their first 30 days. Fixing that single bug reduced support load by 18% and improved activation rates because users weren't getting derailed during onboarding.
This lever has diminishing returns. The first 10 friction points you remove typically deliver 80% of the retention lift. Chasing perfection beyond that often means over-investing in edge cases.
Building a Retention Operating System
Most companies treat retention as a series of one-off projects: revamp onboarding, add a customer success team, build better analytics. What separates high-retention organizations is that they turn these into a continuous operating system with clear ownership, regular review cadence, and systematic learning loops.
Here's the structure that works across the companies we've seen execute this well:
Weekly retention review. One person (usually VP Product or Head of Growth) owns a standing 30-minute meeting focused on cohort performance. The agenda is fixed: review last week's new cohort activation rate, current month retention across active cohorts, and any leading indicators showing cohort degradation (usage decline, engagement drops, support ticket spikes). This isn't about solving problems in the meeting, it's about maintaining visibility so problems get escalated before they compound.
Monthly retention sprint planning. Separate from product roadmap planning, this meeting prioritizes retention experiments based on cohort analysis insights. The framing shifts from "what features should we build?" to "which cohort behavior do we need to change, and what's the smallest experiment to test if we can?" This typically involves product, customer success, and growth working together on hypotheses.
Quarterly retention strategy review. Step back from tactical experiments and assess whether the retention playbook itself needs updating. Are the activation criteria still predictive of long-term retention? Have new cohorts shown different patterns that suggest product-market fit is shifting? Is there a specific segment or use case where retention is exceptionally strong that should inform positioning?
The most common failure mode is treating this as a reporting exercise rather than a decision-making system. The meetings work when they have clear outputs: "based on what we learned, we're killing X experiment and doubling down on Y" or "cohort analysis shows enterprise is stabilizing faster, so we're shifting messaging to attract more of that segment."
One crucial component is setting retention targets by cohort age. Don't just track "overall churn rate." Set specific goals like "month-three retention should be 88% for cohorts acquired through organic channels" or "enterprise cohorts should stabilize at 96% by month six." This creates accountability and makes it obvious when you're off track early enough to respond.
The tradeoff with building this operating system is that it requires dedicated ownership and regular time investment from senior leaders. Early-stage startups often can't afford this overhead. The ROI typically justifies itself once you're past $3-5M ARR and have enough cohort volume to make the analysis statistically meaningful.
When Churn Isn't Churn: Reactivation Economics
The traditional SaaS retention model treats churned customers as permanently lost. In reality, depending on your product category and customer segment, 15-40% of churned users can be reactivated if approached systematically.
This isn't about win-back emails. It's about understanding why customers left and whether those reasons are temporary or permanent. A customer who churned because they lost budget during a downturn has different reactivation economics than one who churned because your product didn't solve their problem.
We've seen reactivation work best in three scenarios:
Involuntary churn. Failed payments, expired cards, billing errors. According to Paddle's 2023 data, involuntary churn represents 20-40% of total churn in B2B SaaS, depending on payment processor and customer segment. Systematic dunning (retrying failed payments, proactive email/SMS notifications, updating cards before expiry) can recover 30-60% of this.
Situational churn. Customer had a legitimate reason to pause (seasonal business, team transition, budget freeze) but the underlying need hasn't changed. A CRM platform we worked with found that 18% of churned customers reactivated within twelve months when contacted with a "checking in" email after six months. The key was qualifying the reactivation attempt: if the customer churned due to missing features, don't reach out until those features exist.
Segment mismatch. Customer churned from your premium tier but would retain on a lower tier, or churned because they needed a different configuration you now offer. This shows up most in products with multiple pricing tiers or use cases. Offering a downgrade path before full churn prevents some of this, but reactivation campaigns that highlight new tiers can recover customers who weren't presented the option initially.
The unit economics matter significantly. If your CAC is $1000 and reactivation costs $150 in sales time plus a discount incentive, winning back even 20% of churned customers at 15% lower ACV still beats acquiring net new at full CAC. Run the numbers for your specific business, reactivation economics vary wildly by segment and product type.
Where this doesn't work is with customers who churned due to fundamental product-market misfit or had a genuinely negative experience. No amount of outreach will overcome a perception that the product doesn't deliver value or the company doesn't support customers well. Chasing those reactivations burns resources and often creates more brand damage.